SKF Rail Track Monitoring
New technology developed by SKF uses the same onboard IMx system as is used for bogie rotating-equipment monitoring to control the condition of the tracks, spotting problems more quickly and enabling rail operators to optimize the planning and execution of track maintenance activities.
Growing populations in metropolitan areas, along with factors such as air pollution and traffic generated by conventional fossil-fuel-based vehicles, are causing people to rely increasingly on mass transit transport solutions. In several cities around the world, demand for metro and suburban trains has exceeded forecasts in recent years. As a consequence, the pressure to increase service quality and availability while keeping risks and costs under control is ever-present in the everyday routine of rail operators.
The strategy applied by rail operators to perform maintenance on the infrastructure plays an important role in preventing disruptions in services and schedules, which are increasingly less tolerated by passengers and railway operators. Track maintenance and renewal activities are usually based on visual inspections and scheduled maintenance to keep tracks in good condition. That approach is long-established but quite costly. Track inspectors can walk the tracks only when trains aren’t running, and dedicated track-inspection vehicles are expensive and usually slow, so updates on the condition of the tracks are also slow.
To improve this situation, SKF has developed a technology to apply its consolidated solutions and know-how to vibration analysis, providing rail operators with tools to monitor the condition of the rail tracks through the use of their trains in normal operations. SKF has been researching this technology in recent years, and field validation tests have been performed specifically in Transports Metropolitans de Barcelona (TMB) in Spain, as well as in other metro operations around the globe. The technology uses vibration sensors mounted onboard standard trains to monitor vibration generated when the train is travelling over the tracks. This enables operators not only to detect track defects, but also to forecast future maintenance needs and targets to keep the rail track quality controlled.

This SKF technology has other advantages. By ensuring good track condition as well as reducing noise emitted during train operation, passenger comfort and overall passenger experience can be enhanced. In addition, there is a correlation between track condition and life expectancy of the wheels and bearings. This correlation is explained by the fact that impacts suffered by the wheels when passing over track defects are directly transferred to the wheelset bearings. By controlling and maintaining the tracks in an appropriate condition, rail operators are also able to extend the service life of the wheels and bearings while enabling smoother train movement.
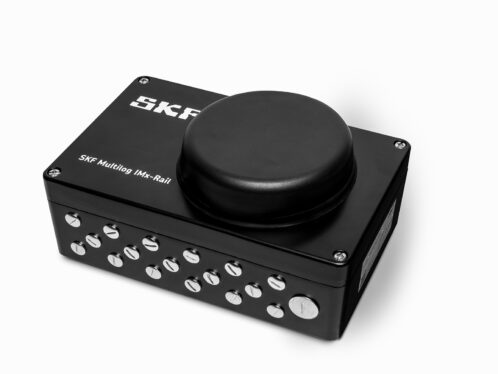
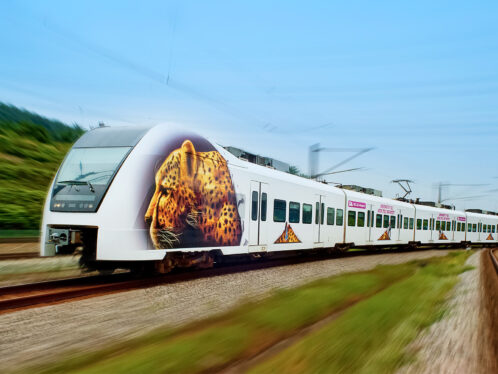
Time is a valuable resource, and the new IMx-Rail (fig. 1a), recently launched by SKF to the market, can be easily and quickly retrofitted to the train (fig. 1b) for track-monitoring purposes. IMx-Rail is the latest of the well-known IMx family of condition-monitoring solutions from SKF, a self-contained solution of sensors and electronics to process and communicate data in commercial operation that may be integrated within rail operator IT systems; it is suitable to be mounted inside the coach or exposed to the external bogie environment. And while its predecessors were originally designed to monitor the rolling stock (wheels, axlebox bearings, gearbox and traction motor), IMx-Rail is, in addition, capable of monitoring the track’s condition. What makes IMx-Rail successful is the simplicity of its integration with existing trains, its reliability and the ease of customer process adaption.

To monitor the track condition of an entire metro line, only one IMx-Rail unit and two vibration sensors are required for measuring and recording, followed by data processing and wireless data transmission to the back-office server collection point, where outliers can trigger maintenance actions.
After data are received at the server, SKF @ptitude Observer software performs a further processing of the information and correlates the vibration measurements with the specific location of the track where they were taken. The algorithms used to identify the location of the measurements is a patent-pending technology developed by SKF that does not require any interconnection to the train’s system to provide input. This not only ensures a rapid installation but also prevents any risk of interference with the train’s safety-critical systems. The software identifies the location of the defects of the track according to the location system used by the rail operator (chainage or kilometric point) and is capable of working accurately for train tunnel service operation.

SKF @ptitude Observer is powered by several dedicated tools to display the information processed, enabling the user to extract the most value from it. When the analysis starts, a table (fig. 2) summarizes the condition of the lines, making it possible to verify the sections of the tracks where the data were recorded. The colour of the section represents a summary of the condition of the tracks according to pre-established thresholds. This enables the user to quickly spot the sections of the track that are in the worst condition and that require maintenance priority.
When the user accesses one of the track sections, the software presents a detailed scatter chart of that particular section, providing a visualization of the details of the track’s condition
(fig. 3). By using this chart, the user can compare the vibration amplitude along different parts of the tracks. The software also provides valuable information such as the time when the measurements were taken and the exact speed over the entire section.

By clicking on a specific area of the scatter chart, the software shows the user a bubble chart that presents the time factor for this area of the track (fig. 4). In this chart, each row of bubbles represents one trip of the train; the size and colour of the bubbles represent the amplitude of the vibration measurements. By using this chart the user can not only compare the amplitude of the vibration during different trips of the train but also follow the evolution of a defect over time.

When the user selects one of the bubbles, the software brings to the screen the waveform and spectra related to that measurement
(fig. 5). By analysing these charts it is possible to verify if the track defect is a localized defect or a defect extended along the track.

In addition, by comparing measurements taken for the same part of the track during different trips of the train, it is possible to verify the reliability of the analysis (fig. 6), avoiding false detections of track defects. Similar vibration signatures observed in different measurements for the same part of the track mean that the vibration measured has actually been generated by the track or by the interaction between track and wheel, not by other random or external sources such as the impact of a flying ballast hitting the bogie’s frame.
Once the analyst identifies a track defect, dedicated tools can be used in @ptitude Observer to report an exception. This exception contains all the information related to the track defect.

SKF @ptitude Observer has an embedded user-friendly interface to be used by the rail operator as a reporting application. This user interface (UI) was designed to be easy to use and to understand, without any level of technical knowledge required. It contains screens that present the information in the form of an executive summary, as well as tools and screens for the user to dig into the details if desired. The UI also contains tools to easily update the charts and dashboards after the repair of a track defect has been performed.
The first screen presented to the user in the UI is a geographical map with a representation of the condition of the lines (fig. 7). The map contains several levels of detail. At the highest level the user can visualize each section of the track between two stations, represented as two straight lines. The colour of the lines summarizes the condition of that section of the track for each particular bound. In this level of detail, the map also displays notes describing how many exceptions have been reported by the analyst for each section of the track.

All the information related to the exceptions reported by the analyst is available to the rail operator. This includes, for example, the range of chainage or the kilometric point where the exception was observed, the date when it occurred, the severity reported by the analyst, the specific side of the track and more (fig. 8).

During the reporting process, the analyst is able to attach to the exception reported the charts used to detect a track defect (fig. 9). These charts are accessible to the rail operator through the UI, allowing the user to dig in and understand the nature of the defects reported.
This UI can be accessed remotely by a local network or even through the internet, which makes it very flexible as it allows operators to access the reporting information from a location different from where the analyst is based.

The software developed includes many useful features, bringing to operators such as Metro Barcelona state-of-the-art technology for the maintenance of rail infrastructure. “We are always looking for better ways to deliver a safe, reliable and cost-effective network,” says Fernando Vaquero Granados, rolling stock engineer at TMB. “Technologies such as SKF Rail Track Monitoring System can help to identify issues more quickly and target our inspection and maintenance activities more effectively.”
By controlling their tracks with the SKF Rail Track Monitoring System, operators can prioritize the maintenance of their tracks more efficiently and rest assured that their tracks’ condition is preserving passenger comfort and the health of wheels and bearings.
Summary
As mass transit grows in importance for cities around the world, keeping train tracks in good condition is crucial. Good track condition enhances passenger comfort and extends the life of wheels and bearings. SKF has developed a technology to monitor the condition of the track through vibration analysis.
@ptitude is a registered trademark of the SKF Group
Keep me updated
Sign up here for EVOLUTION updates to receive new content directly to your inbox.