Paper mill gains from condition monitoring
State-of-the-art papermaking machines combined with an ability to more closely monitor machine vibration are reaping significant savings for Sappi’s Gratkorn mill, producers of high-quality wood-free coated papers.
Early detection of machinery problems and scheduled repairs avoid costly loss of production due to unplanned machine stoppages. Sappi’s overall plan for mill productivity coordinates each mill’s production, engineering and maintenance efforts to ensure continuous improvement to mill productivity. This plan recognises SKF’s vibration monitoring systems as valuable tools for machine condition monitoring and root-cause failure analysis. To get the earliest detection of bearing problems, the Sappi Gratkorn team relies heavily on its enveloped acceleration measurements’ overall trend alarms. (SKF’s enveloped acceleration technology was a major factor in Sappi Gratkorn’s decision to purchase SKF vibration monitoring systems.)
Gratkorn has been the site of paper production for more than 400 years. Today, the Sappi Gratkorn mill has the largest production line worldwide for high-quality woodfree coated papers, with an annual output of 470,000 tonnes. SKF’s monitoring systems have been applied since 1995 to ensure the Gratkorn mill’s two paper machines and two off-line coating machines maintain maximum production time. In fact, an SKF on-line vibration monitoring system was installed in the new Papermaking Machine 11 (PM11) during the machine’s assembly and has been continuously monitoring machine vibration since the machine’s start-up. Currently, five of Sappi’s European mills use SKF Condition Monitoring on-line as well as portable vibration monitoring systems.
Charting success
During the assembly of PM11, SKF condition monitoring equipment was built into the machine. Since then, machine vibration has been monitored continuously. To illustrate the effectiveness of such an early warning system, from the time PM11 went on line to the writing of this article, 25 machinery problems have been detected. Of these, 23 were detected early enough to analyse, trend and repair during a scheduled machine stoppage. This represents a success rate of 92 percent.
Sappi calculations estimate that loss of production revenue due to an unplanned stoppage on PM11 exceeds 20,000 US dollars an hour. Theoretically, in less than two years of operation, early detection of machine problems has saved Sappi about USD 4 million in potential lost production revenue. And this figure does not account for other unplanned stoppage costs such as secondary damage that often occurs when problem components are run to catastrophic failure.
One of the key success factors at Gratkorn is the systematic approach taken by the mill’s Condition Monitoring team. Chief analyst Kurt Neiser leads a team of four technicians, each of whom monitors the condition of a specific machine – the PM9 and PM11 papermaking machines, and the SM9 and SM11 off-line coating machines.
From system hardware installation through data collection measurements and documentation of system events, every aspect of the monitoring systems at Sappi Gratkorn has been systematised to consistently achieve optimal performance. A well-thought-out on-line vibration monitoring system installation is vital to consistent success. At Gratkorn, consideration was given to:
- the easiest and most reliable way to install the monitoring system hardware;
- the most effective vibration measurements for detecting paper machine problems;
- the best setting for alarms to automatically detect machine problems;
- appropriate responses to detected problems, including the most effective analysis methods and techniques;
- documentation of vibration monitoring system events so as to best schedule repairs; and
- how to use documentation as a basis for improving effectiveness.
Once the implications of these issues were discussed, a uniform method for applying the system to each machine was determined. Such uniformity provides consistent information about all monitored equipment, and allows for the exchange and comparison of data relating to monitoring systems and machine conditions.
Hardware installation
With a large papermaking machine, the monitoring system’s installation is a huge task in itself. Some of the major considerations of hardware installation are discussed below.
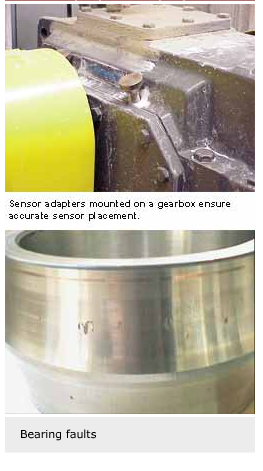
Vibration sensors convert mechanical movement to an electrical signal. This electrical signal can be measured and “conditioned” by monitoring system hardware to produce valuable information about a machine component’s vibration characteristics. Every roll on PM11 has an SKF sensor permanently mounted on the bearing at each end of the roll. All sensors have waterproof connection systems, except in the press section where integral sensor cables were used. To allow sensors to be quickly mounted on curved surfaces (the radial sensor mounting position), Sappi staff devised special sensor adapters. The adapters allow the sensors to be mounted in the radial position without grinding a flat spot on the roll surface.
Press section sensors were installed with integral sensor cables. For easier maintenance, future press section installations will also use waterproof sensor connectors. On the PM11’s dryer cylinder rolls, which all use SKF CARB® bearings, sensors are mounted in the axial position. All other rolls have sensors mounted radially. Where possible, both axial and radial sensors are positioned in the bearing’s load zone to minimise vibration signal attenuation.
Monitoring vibration at the bearings is important for two reasons.
Firstly, catastrophic bearing failure halts machine operation. Monitoring changes in bearing vibration provides early detection of bearing problems and allows corrective action to be scheduled during normal maintenance routines. Secondly, because the bearings carry the machine’s load, many typical machine problems such as imbalance, misalignment and looseness transmit vibration signals to the bearings. So by monitoring vibration at the bearing, analysts can also be alerted to these typical causes of bearing problems.
Sensor wires are run through conduits to stainless steel junction boxes situated outside the machine. In the press section, conduits are made from stainless steel; in other machine sections, they are made from aluminium. Although conduits are somewhat expensive, they protect the sensor wire and highlight the importance of the monitoring system to maintenance and operation crews working on the machine.
Each junction box is situated 20 to 30 metres from its sensors. The location has been chosen so that it is convenient to connect the optimal number of sensor wires. In addition, situating these junction boxes away from the machine avoids exposing them to the machine’s harsh, wet environment.
These junction boxes use terminal strip connectors to route individual sensor wires to a multicore cable running the sensor signals to nearby SKF Local Monitoring Units (LMUs). LMUs for PM11 are mounted in RittalTM cabinets located in a motor control room near the junction boxes. This area provides a clean, dry, cool environment for LMU operation and a convenient location for working on LMU hardware. Typically three or four LMUs are mounted in each cabinet, with several cabinets situated in each motor control room.
Monitoring system overview
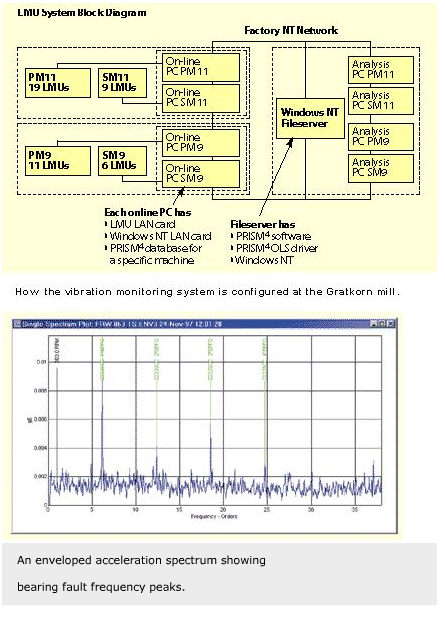
Each of the mill’s papermaking machines and off-line coating machines has its own dedicated SKF on-line vibration monitoring system. Each monitoring system consists of a number of SKF LMUs continuously measuring the machine’s vibration. For example, PM 11 has 19 LMUs. Each LMU is a self-contained programmable monitoring unit capable of performing 128 measurements on up to 32 sensor inputs. The collected measurements are automatically uploaded through a local area network to a host computer running SKF’s PRISM4/On-Line software for permanent storage and analysis of collected measurements.
At Gratkorn, each LMU is fully loaded with 31 or 32 sensor inputs. Some 600 sensors are mounted on PM11 alone. Each LMU is networked to its system’s on-line host computer situated in an office near the machine. These host PCs are networked back to a central fileserver that is situated in the vibration team’s office in a different building. The office also contains four analysis PCs that are networked to the fileserver. It is from this office that the four vibration technicians monitor and analyse the condition of their machines.
The type of vibration measurements performed is key to the success of the system. The Gratkorn team applies a logical, two-step approach to solving machine problems in early fault stages. They first monitor each bearing using two “detection type” measurements specifically set up to detect machine problems in early defect stages. Then, when the monitoring system flags a problem, the team reacts with a second set of “analysis type” measurements set up to best analyse papermaking machine problems for severity and defect development.
The system’s detection measurements had to be fast and reliable, with accurate alarm settings. Selecting the best measurements and setting accurate alarm levels required experience with paper machine vibration monitoring techniques and experience with the “normal” vibration levels of every monitored component on the machines (only when the normal vibration level is understood can an exception to normal level be detected).
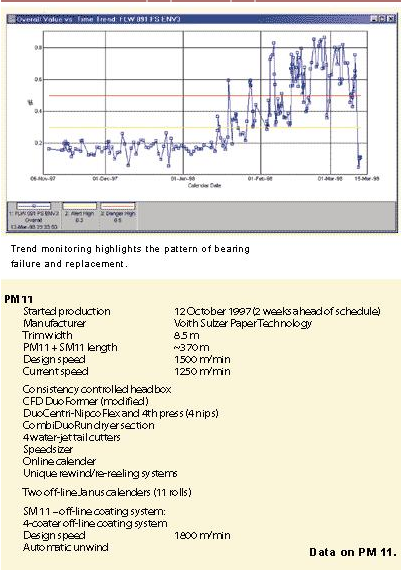
The team allowed the machines to “settle in” during a commissioning period to gather vibration trend information for each monitored bearing. When a bearing’s vibration trend indicated a consistently good working condition, the team sets the measurement alarm levels above the trend level. When appropriate, adjustments to alarm settings are made, especially after a repair or when the machine’s speed is changed.
The team used an enveloped acceleration measurement to isolate and monitor each bearing’s vibration signal. Simply put, the enveloped acceleration measurement filters out all machine vibration signals not caused by bearing type faults, leaving a much clearer picture of any bearing fault vibration signal and allowing tighter alarm settings and earlier detection of problems with the bearing itself. The Sappi Gratkorn team relies heavily on the enveloped acceleration measurements’ overall trend alarms to obtain the earliest detection of bearing problems. SKF’s ability to provide this technology was a major factor in the papermaker’s decision to purchase the system.
The other detection measurement is a standard ISO vibration velocity measurement that focuses on vibration caused by general machine faults such as imbalance, misalignment and looseness. With these two detection type measurements, the team is provided with early, automatic detection of almost any machinery problem. Indeed, the team relies totally on the system to detect changing machinery conditions, and only when the system indicates an alarm do the vibration technicians react.
Fault analysis
It is important to note that a system alarm does not usually indicate an emergency situation. With the on-line vibration monitoring systems collecting multiple measurements daily and enveloped acceleration measurement technology providing early bearing fault detection, bearing problems are normally minor when they are identified. Typically, there is plenty of time to analyse and track the problem to schedule its repair during a planned machine stoppage.
Initially, because the measurements provide such early warnings, the team removed suspect bearings too soon. They had to get used to the fact that enveloped acceleration measurements provided very early bearing fault detection, and had to adjust their reaction time appropriately. Of course, exceptions always exist, and reliability technicians act quickly to avoid catastrophic failure if the detected fault is analysed as, for example, a crack on the bearing’s inner raceway surface.
When a monitoring system raises an alarm, the team’s reaction is a systematic analysis and trending of the suspect bearing’s vibration. The interval at which the technician analyses the bearing’s vibration data – trend and spectral plot – is increased from once every other week to daily. If, during this analysis, spectral peaks are observed at associated bearing frequencies, four standardised analysis type measurements are downloaded to the LMU monitoring the suspect bearing, bringing the total number of measurements performed on the bearing to six.
The four analysis measurements produce higher resolution vibration data and can isolate specific problem areas. They help the technician identify the type of problem, its severity and its root cause. As already mentioned, bearing faults can often be initiated by other machinery or maintenance problems such as improper lubrication, improper installation or excessive load caused by roll imbalance or misalignment. By correcting the root cause, the technicians avoid the repetition of bearing problems.
The suspect bearing is classified according to five stages of bearing degradation. These range from Stage 1, minimal bearing wear, to Stage 5, major spalling in load zone, i.e. fatigue, bearing destruction imminent. As the bearing condition deteriorates, the technicians evaluate its progression through the five stages using several criteria, which include:
- the appearance of bearing fault frequency peaks in the enveloped acceleration measurement’s spectral data;
- the rate at which the enveloped acceleration measurement’s overall trend amplitudes are rising; and
- whether bearing fault frequency peaks appear in the velocity measurement’s spectral data, typically indicating a high severity level.
Based on these criteria and the proximity of the next scheduled machine stoppage, the technician attempts to schedule the bearing’s replacement during a planned machine stoppage. If identified, the root cause of the problem is also addressed.
Drive train measurements
In addition to on-line vibration monitoring systems, the team also owns six SKF Microlog portable vibration data collectors/analysers. These portable units are used to monitor drive train equipment that is not part of the papermaking machines or coating machines.
On a fixed schedule, maintenance technicians walk a specific data collection route with their Microlog, performing standard detection measurements on each machine’s motors, pumps and gearboxes. Route data collection schedules vary from once every two weeks to once every two months, depending on the monitored equipment’s speed and how critical the equipment is to the overall process. Faster, more critical equipment is monitored more closely. Collecting and analysing this off-line data is no small task. For PM11, including its off-line coating machine and off-line calender stack, maintenance technicians regularly monitor 2,680 measurements with portable Microlog units.
During data collection, the technician connects a hand-held sensor to the machinery, using a magnetic sensor attachment. Each measurement location is clearly defined, as the team has installed sensor mounting pads to allow easy connection with the Microlog’s portable sensor. After all data are collected for the route, the maintenance technician connects the portable Microlog to the system’s fileserver and uploads the collected vibration data to the system’s PRISM4 analysis software for long-term storage and analysis.
If any of the collected measurements cause an alarm, the reliability team returns to the suspect component with a portable Microlog to perform more in-depth analysis measurements. The technicians again use both enveloped acceleration and velocity measurements to determine the type, severity and root cause of the problem. With Micrologs, since the sensor is not permanently attached to the machine, they also perform measurements at various sensor locations. They are consistent with their on-line system analysis practices in shortening their measurement intervals to more closely monitor the suspect component, and in staging the problem to one of their five standard stages of bearing wear.
Documentation
The team at Gratkorn has developed standardised reports to document every event on their vibration monitoring system. These reports include a description of the event from problem detection to failure analysis results on the bearing after it has been removed from the machine. Every attempt is made to determine if and why the bearing failed prematurely.
Pre and post-failure vibration levels are noted, vibration trend and spectral plots are imported into the report from the monitoring system’s PRISM4 analysis software, and a digital photograph of the bearing fault is always included.
Each report also includes a calculation of theoretical savings of lost production revenue gained by not allowing the problem component to run to catastrophic failure. This is a simple calculation based on the amount of time it takes to repair a specific problem multiplied by the Sappi estimate of loss of production revenue due to an unplanned machine stoppage. As mentioned earlier, unplanned stoppage on PM can cost in excess of USD 20,000 / hour.
These theoretical savings of lost production revenue are considered conservative, as they are based upon actual repair time during a scheduled machine stoppage, when the repair has been planned. Often, unplanned repairs take longer, because personnel, parts and tools must be assembled while the machine is stopped. Also not accounted for is secondary damage that usually arises from running a component to catastrophic failure. These documented reports of system events are stored in binders and made accessible for comparison with future system events, serving both as an analysis resource and as a valuable training tool.
The term “running like a well-oiled machine” applies to more than the state-of-the-art papermaking machinery at Gratkorn; it also applies to the mill’s effort to keep the machinery running at peak performance levels. Thanks to Sappi’s organised, systematic team approach to production, maintenance and machinery condition monitoring, and to SKF’s vibration monitoring systems, machine vibration levels and the mill’s maintenance costs continue to decrease, while machine speed and the mill’s production revenues continue to increase.
Doug Swansen, manager, Technical Documentation,
SKF Condition Monitoring, San Diego, California, USA
Special thanks to: Kurt Neiser, Technical Department, Sappi, Gratkorn;
Andre Smulders, ma


